There is an old accounting proverb that every entrepreneur eventually learns, often the hard way: "Revenue is vanity, profit is sanity, but cash flow is reality." A company can generate $5 million in top-line sales and still be on the brink of bankruptcy if it costs $5.1 million to fulfill those orders. Top-line revenue tells you how much activity is taking place; your profit margin reveals whether that activity is actually worth doing.
Whether you are pricing a new physical product, setting hourly consulting rates, or preparing financial statements for investors, understanding how to dissect and optimize your profit margins is the single most leveraged skill in business finance.
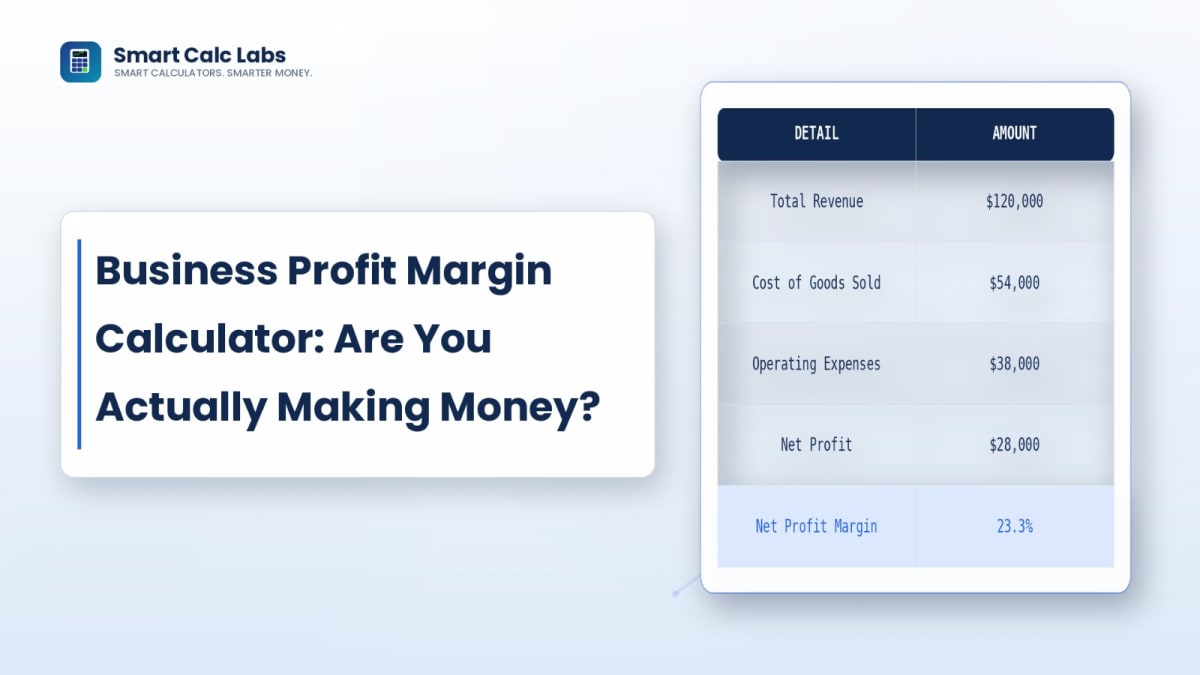
Use our free Business Profit Margin Calculator to test your numbers in real-time, or read on to master the formulas, industry benchmarks, and pricing strategies below.
The Three Levels of Profit Margin Explained
One of the most frequent financial mistakes founders make is using the blanket word "margin" without specifying which level of profitability they are measuring. Financial accounting breaks profitability into three distinct tiers:
| Metric | What It Measures | Formula | What It Diagnoses |
|---|---|---|---|
| 1. Gross Profit Margin | Efficiency of direct production & unit fulfillment | ((Revenue − COGS) ÷ Revenue) × 100 |
Product pricing power, material costs, direct labor efficiency |
| 2. Operating Profit Margin (EBIT) | Profitability after operational overhead & SG&A | ((Gross Profit − Operating Expenses) ÷ Revenue) × 100 |
Management discipline, marketing ROI, software and rent overhead |
| 3. Net Profit Margin | The final bottom-line retained per dollar of sales | ((Operating Profit − Taxes − Interest) ÷ Revenue) × 100 |
Total financial viability, debt burden, tax structure efficiency |
1. Gross Profit Margin: The Unit Economics Litmus Test
Gross margin evaluates how efficiently your business turns raw inventory, parts, or direct subcontractor labor into finished goods and delivered services.
Cost of Goods Sold (COGS) includes only expenses directly tied to producing the good or service: raw materials, packaging, freight-in, direct assembly wages, and merchant payment processing fees. It does not include administrative salaries, software tools, or advertising spend.
Example: An e-commerce brand sells an ergonomic desk chair for $300. The manufacturer charges $90, shipping to the customer costs $20, and packaging costs $10 (Total COGS = $120).
Gross Margin = ($180 ÷ $300) × 100 = 60.0%
2. Operating Profit Margin: Measuring Operational Overhead
Operating margin (often called EBIT margin — Earnings Before Interest and Taxes) accounts for the costs of running the business day-to-day. This captures your Selling, General & Administrative (SG&A) expenses: office leases, digital marketing budgets, founder and executive salaries, customer support tools, legal retainers, and utility bills.
If your gross margin is 60% but your operating margin is -5%, you do not have a product pricing problem — you have an overhead or customer acquisition problem.
3. Net Profit Margin: The True Bottom Line
Net profit margin is the ultimate report card. It takes operating income and subtracts non-operating expenses: interest payments on commercial loans or lines of credit, federal, state, and local income taxes, and one-off write-offs.
If your net margin is 15%, your company generates exactly 15 cents of real cash profit for every $1.00 customer payment received.
Markup vs. Margin: The Costly $17,000 Confusion
Mixing up markup and profit margin is arguably the most common pricing blunder made by new business owners, and it leads directly to underpriced inventory.
- Markup is the percentage added to the cost to determine selling price:
((Price − Cost) ÷ Cost) × 100 - Margin is the percentage of the selling price retained as profit:
((Price − Cost) ÷ Price) × 100
| Cost ($) | Target Markup | Selling Price | Dollar Profit | Actual Profit Margin |
|---|---|---|---|---|
| $100 | 25% | $125 | $25 | 20.0% |
| $100 | 50% | $150 | $50 | 33.3% |
| $100 | 100% (Keystone) | $200 | $100 | 50.0% |
| $100 | 300% | $400 | $300 | 75.0% |
The Takeaway: A 50% markup produces only a 33.3% gross profit margin. If your business has 35% overhead expenses and you mark up goods by 50%, you are losing money on every single sale despite "marking up" prices by half.
Industry Profit Margin Benchmarks: What is a "Good" Margin?
A 7% net profit margin is catastrophic for a boutique consulting agency, but award-winning for a high-volume supermarket chain. Margin health must always be evaluated within your industry's operating model:
| Industry Sector | Typical Gross Margin | Typical Net Margin | Operating Dynamics |
|---|---|---|---|
| SaaS & Software | 75% – 90% | 15% – 30% | Near-zero reproduction costs; heavy upfront R&D and customer acquisition spend. |
| B2B Professional Services | 50% – 70% | 15% – 25% | High hourly realization rates, minimal inventory, labor-constrained scale. |
| E-commerce & Direct-to-Consumer | 45% – 65% | 8% – 15% | Vulnerable to rising customer acquisition cost (CAC) and fulfillment inflation. |
| Restaurants & Food Service | 60% – 70% | 3% – 8% | High food & beverage gross profit offset by intense commercial rent and kitchen labor. |
| Construction & General Contracting | 15% – 25% | 4% – 7% | Capital intensive, heavy subcontracting costs, dependent on milestone cash flow. |
| Grocery & Supermarkets | 20% – 25% | 1% – 3% | Ultra-lean margins supported by extreme inventory velocity and volume turnover. |
The 4 Mathematical Levers to Improve Your Profit Margins
When margins begin to shrink, founders often panic and try to sell more volume. However, selling more units of an unprofitable product only accelerates cash burn. Instead, focus on these four levers:
1. Strategic Price Optimization
Because fixed costs remain constant, a small percentage increase in price creates an exponential surge in net profit.
The Math: Suppose your business makes $1,000,000 in revenue with $800,000 in total costs, leaving $200,000 in net profit (a 20% margin). If you increase prices by just 7% across the board with no drop in unit sales, revenue becomes $1,070,000 while costs stay at $800,000. Your profit increases from $200,000 to $270,000 — a 35% surge in net profit from a modest 7% price adjustment.
2. Direct COGS Renegotiation
Audit your bills of materials (BOM). Can packaging weight be reduced by 15% to lower courier freight charges? Can raw materials be purchased on 60-day volume terms? A 3% reduction in COGS goes directly to your gross bottom line.
3. Eliminating Unprofitable Product Lines (Margin Attribution)
Blended margins hide unprofitable lines. A company with a 22% overall margin often has one flagship service operating at a 45% margin subsidizing a secondary offering operating at a -5% margin. Run individual margin analyses on each SKU and either reprice or sunset money-losing services.
4. Aligning Margins with Break-Even Capacity
Use our Break-Even Analysis Calculator to cross-reference your unit contribution margins against your total fixed monthly overhead. This tells you the exact unit volume required before you enter pure profit territory.
Frequently Asked Questions
How do I calculate profit margin if I only know unit cost and desired margin?
To find the selling price needed for a target margin percentage, use the pricing formula: Selling Price = Unit Cost ÷ (1 − (Target Margin % ÷ 100)). For example, if an item costs $60 to produce and you want a 40% gross margin, divide $60 by 0.60 to get a target selling price of $100.
Why is my gross margin high but my net margin negative?
This indicates an operational overhead issue rather than a product pricing flaw. Common culprits include excessive digital advertising costs (high customer acquisition cost), bloated recurring software subscriptions, expensive office leases, or executive payroll exceeding the company's current stage of scale.
How often should small businesses recalculate their margins?
You should calculate gross margins monthly and full net margins at the close of every quarter. Waiting for annual tax filings creates an 11-month blind spot where supplier price hikes or discounting habits can quietly drain reserves.
Conclusion: Take Control of Your Numbers Today
Sustainable businesses are built on healthy, resilient margins. Before you launch your next marketing campaign or take on additional overhead, test your financial assumptions using our interactive Business Profit Margin Calculator to ensure every dollar of revenue is pulling its weight.