"Renting is throwing money away" is one of the most repeated pieces of financial advice — and it's often wrong. With 30-year mortgage rates sitting around 6.6%-6.8% as of August 2026, the math on buying vs. renting has shifted meaningfully from the sub-4% era, and in a lot of markets renting now wins for years longer than people assume.
Run your actual numbers through the Rent vs Buy Calculator — the breakdown below explains what the calculator is actually weighing.
The "5% Rule" — A Fast Sanity Check
Before running detailed numbers, there's a quick heuristic worth knowing: total annual costs of ownership (mortgage interest, property tax, maintenance, and opportunity cost of your down payment) typically run about 5% of the home's value per year. Divide that by 12, and compare it to monthly rent for a similar property. If a $400,000 home costs roughly $1,667/month by this rule and comparable rent is $2,400/month, buying likely wins. If rent is $1,400/month, renting is probably cheaper — at least for now.
What the Full Calculation Actually Includes
The 5% rule is a shortcut. A real comparison needs to account for:
- Total interest paid — at a 6.65% rate, a $300,000, 30-year mortgage costs roughly $394,000 in interest alone over the full loan term, on top of the principal.
- Property taxes and insurance, which renters never pay directly and which typically add 1-2% of home value annually.
- Maintenance, generally budgeted at 1-2% of the home's value per year — a $400,000 home might realistically need $4,000-$8,000/year in upkeep, repairs, and eventual replacements (roof, HVAC, water heater).
- The opportunity cost of your down payment. A 20% down payment on a $400,000 home is $80,000 that could otherwise be invested. If that money would have earned 7% annually in the market, that's a real cost of homeownership, not just "equity you're building."
- Home price appreciation, which is the main financial argument for buying — but it's a projection, not a guarantee, and varies enormously by local market.
The Breakeven Timeline Is the Real Question
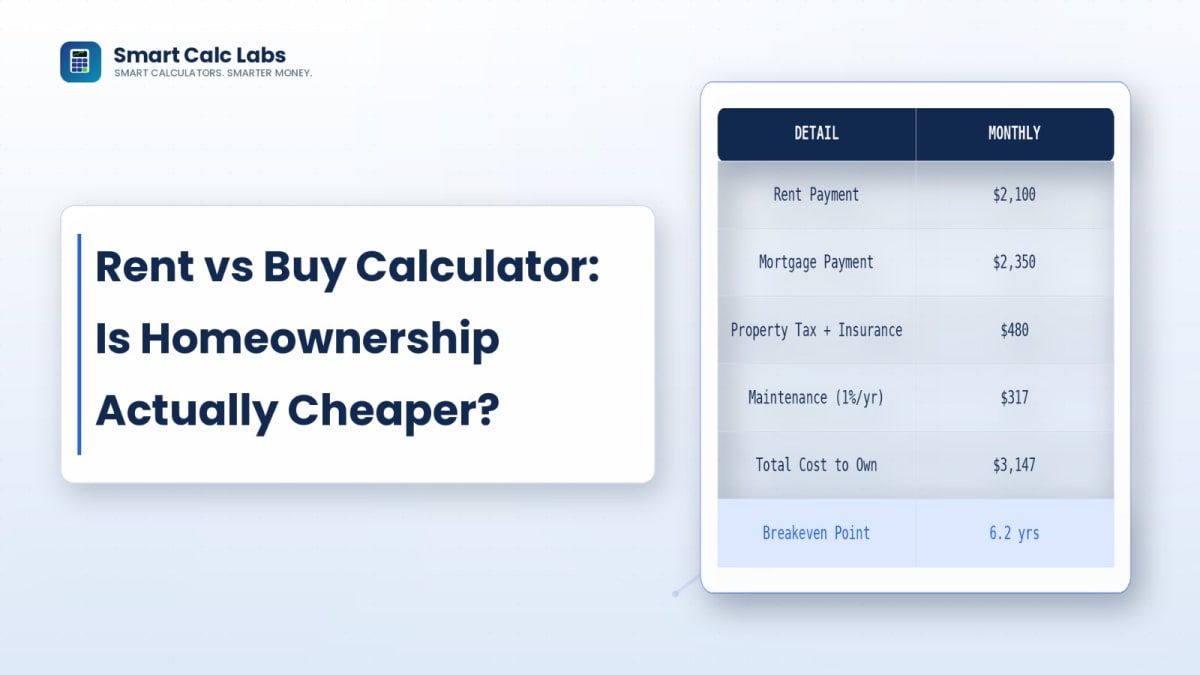
Buying almost always loses to renting in year one — closing costs (typically 2-5% of the purchase price) and the upfront transaction costs mean you're behind before you even move in. The real question isn't "is buying cheaper," it's "how many years do I need to stay for buying to catch up?" In most markets at current rates, that breakeven point lands somewhere between 4 and 7 years. If you're confident you'll stay put that long, buying tends to win. If there's a real chance you'll relocate within 2-3 years for a job or other reason, renting is very likely the better financial move regardless of the local rent-vs-mortgage gap.
Common Mistakes in This Comparison
- Comparing rent to only the mortgage principal and interest. The true cost of owning also includes taxes, insurance, HOA fees if applicable, and maintenance — leaving these out makes buying look artificially cheap.
- Treating the down payment as "free" money going into the house. It has a real opportunity cost if it could have been invested elsewhere instead.
- Assuming rent never changes. Rent typically rises 3-5% per year, while a fixed-rate mortgage payment (excluding taxes and insurance) stays flat for 30 years — this favors buying the longer your time horizon extends.
- Ignoring selling costs. When you eventually sell, realtor commissions and closing costs typically eat 6-8% of the sale price — a cost renters never face.
Putting It Into Practice
- Get your real mortgage rate quote rather than using a national average — your credit score and down payment size can shift your rate by 0.5% or more, which meaningfully changes the comparison.
- Estimate your realistic time horizon in the home — this single input matters more than almost any other variable.
- Run both scenarios through the calculator using your actual rent, actual mortgage terms, and a conservative appreciation estimate (historically, home prices have appreciated roughly in line with inflation over long periods, with significant regional variation).
- Check the breakeven year the calculator produces against how long you actually expect to stay.
Before You Rely on This
This comparison depends heavily on local market conditions, which vary enormously by city and even by neighborhood. National mortgage rate averages, appreciation rates, and rent growth are inputs — your specific market may behave very differently. Treat the output as a framework for thinking, not a guarantee of which choice will be cheaper.
Disclaimer: The content provided on SmartCalcLabs is for educational and informational purposes only. We are not certified financial planners or real estate professionals. You should always consult with a licensed professional before making significant financial decisions.
The Unrecoverable Costs Framework: Mortgage Amortization Curves and Equity Drag
The standard cultural narrative that "renting is throwing money away while buying builds equity" collapses under rigorous financial analysis. As demonstrated by financial analyst Ben Felix and institutional housing economists, both renting and homeownership have substantial unrecoverable friction costs that generate zero equity value.
The Three Unrecoverable Costs of Homeownership
When you purchase real estate, your monthly cash outlay does not convert 1:1 into net worth. Instead, homeownership carries three distinct unrecoverable expenditures:
- 1. Cost of Debt (The Amortization Curve): Because mortgage loans are front-loaded with interest, the vast majority of payments in early years build zero principal equity. On a $550,000 mortgage at 6.75% fixed for 30 years, the monthly Principal & Interest payment is $3,568. In Year 1, an astounding $3,070 of every $3,568 monthly payment (86.0%) goes directly to lender interest. Over a standard 7-year ownership cycle before relocating, the homeowner pays $244,000 in interest and only $55,000 toward principal.
- 2. Property Taxes & Special Assessments: Depending on jurisdiction, municipal property tax rates range from 0.7% to over 2.4% of assessed valuation annually. On a $650,000 property, property taxes consume $5,000 to $15,600 per year ($416 to $1,300/month)—money that vanishes to local tax authorities with zero equity accrual.
- 3. Maintenance, Capital Expenditures, and HOA Fees: Under the standard 1% to 1.5% maintenance rule, residential property depreciates constantly. Replacing a 30-year architectural shingle roof ($14,000), a dual-zone HVAC heat pump ($12,000), or repiping aging water lines costs 1.0% to 1.5% of the property's value annually ($6,500 to $9,750/year).
The Opportunity Cost of Down Payment Capital
The second hidden cost of homeownership is the cost of equity capital. A buyer deploying a 20% down payment ($130,000 on a $650,000 purchase) plus $19,500 in closing costs, escrow prepaids, and immediate move-in adjustments locks $149,500 of liquid capital into a single illiquid physical asset.
If that identical $149,500 remained invested in a globally diversified index portfolio (e.g., S&P 500 or global equities) generating a historical 7.0% real return, it produces $10,465 per year ($872/month) in compounding equity growth. When comparing housing options, if your local rent is lower than the sum of an owner's unrecoverable costs (Mortgage Interest + Property Taxes + Maintenance + Capital Opportunity Cost), renting and investing the monthly surplus is mathematically superior to homeownership.
Frequently Asked Questions
Is buying always better if I plan to stay long-term?
Generally, yes — the longer your time horizon, the more a fixed mortgage payment and eventual full home equity outweigh renting's flexibility. Most breakeven analyses favor buying somewhere past the 5-7 year mark, though local market conditions can shift this.
How much do current mortgage rates change the equation compared to a few years ago?
Significantly. At 3% rates, monthly ownership costs on a given loan amount were far lower, shortening the breakeven period. At today's roughly 6.6%-6.8% rates, the same loan amount costs substantially more in interest, which pushes the breakeven point out and makes renting more competitive for shorter time horizons.
Should I include the possibility of refinancing later at a lower rate?
You can model it as a "what if," but it's speculative — nobody can predict future rates reliably. It's safer to run your comparison using today's actual rate and treat any future refinance as a potential bonus rather than a plan.
Bottom Line
Whether buying or renting wins depends on your specific numbers, your time horizon, and your local market — not on a blanket rule either way. Run your actual rent, actual mortgage quote, and realistic time horizon through the calculator rather than relying on generic advice from either side of this debate.