In 1913, the United States Congress passed the Federal Reserve Act, establishing the modern American central banking system. In that same year, one US dollar could comfortably purchase 30 Hershey's chocolate bars, a dozen fresh eggs, a pound of butter, and a pint of milk, with change to spare. Today, that exact same single dollar cannot even purchase a single candy bar or a cup of black drip coffee.
According to historical Consumer Price Index (CPI) data from the Federal Reserve Economic Data (FRED) system, the US dollar has lost over 97% of its cumulative purchasing power since 1913. Understanding why this decay happens — and how real productive assets protect you against it — is the single most crucial concept in long-term financial preservation.
Use our free Purchasing Power Calculator to track the exact real-world value of past and future dollars, or read on to explore the 100-year history of monetary erosion.
The 100-Year Timeline of Dollar Purchasing Power Decay
The erosion of the dollar has not happened in a straight line. Instead, it has accelerated during specific historical turning points where monetary expansion and structural economic shocks altered the monetary base:
1. 1913–1944: The Creation of the Fed & World War Inflation
Prior to 1913, the United States operated under a strict classical gold standard, resulting in alternating periods of mild inflation and deflation with long-term price stability. Following the creation of the Federal Reserve and the massive government spending required for World War I and World War II, the money supply expanded rapidly, causing the dollar to lose more than 50% of its initial 1913 purchasing power by the mid-1940s.
2. 1971: The Nixon Shock & The End of Bretton Woods
Under the post-war 1944 Bretton Woods agreement, global currencies were pegged to the US Dollar, which was strictly convertible to gold at $35 per ounce. On August 15, 1971, President Richard Nixon unilaterally suspended the dollar's direct gold convertibility ("closed the gold window"). For the first time in modern history, the US Dollar became a pure unbacked fiat currency. The decade that followed saw double-digit annual inflation throughout the 1970s, cutting the dollar's real value in half in less than ten years.
3. 2008–2026: Quantitative Easing & The Post-Pandemic Shock
The 2008 Global Financial Crisis introduced large-scale Quantitative Easing (QE), permanently shifting central bank balance sheets. In 2020–2022, unprecedented fiscal stimulus combined with supply chain disruptions triggered the highest annual inflation rates in 40 years (peaking over 9% in 2022). Even as inflation moderates to between 3% and 3.5%, cumulative consumer prices remain permanently higher, locking in the permanent loss of purchasing power.
The Historical Purchasing Power of $100 (1913–2026)
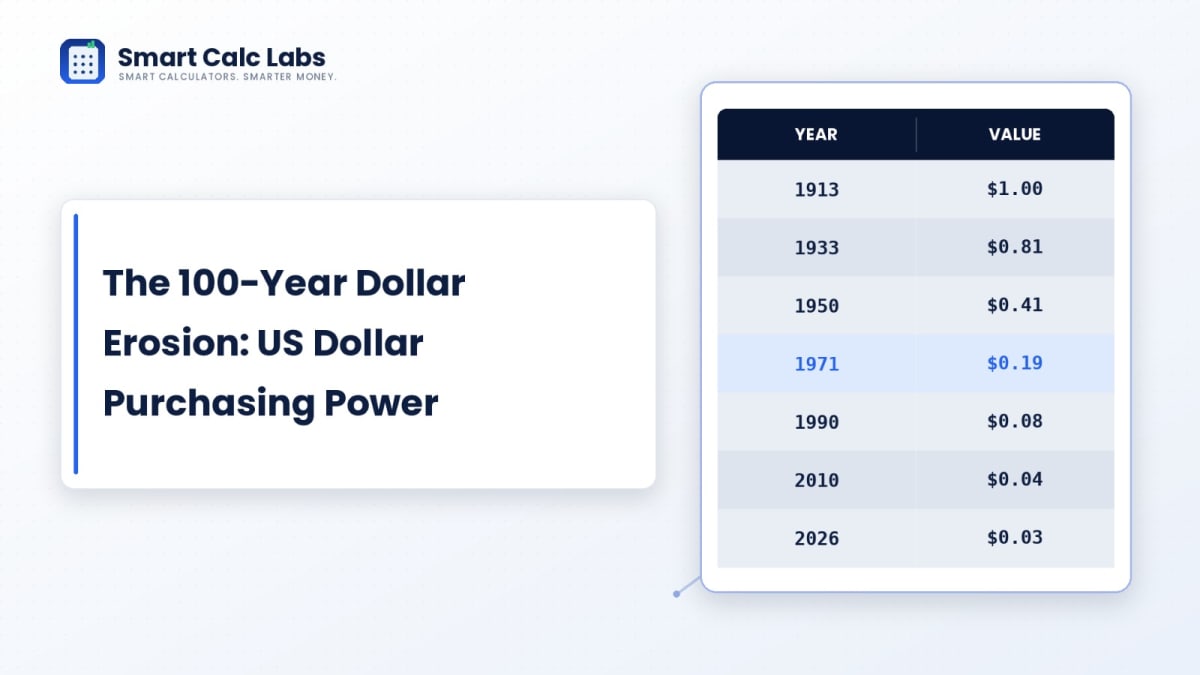
To visualize how dramatic this erosion has been, the table below demonstrates what an initial $100 sum in 1913 would be worth in real purchasing power across subsequent economic eras:
| Year / Milestone | CPI Index Level | Original $100 Real Value | Equivalent Dollars Needed Today |
|---|---|---|---|
| 1913 (Fed Founded) | 9.9 | $100.00 | $100 |
| 1945 (End of WWII) | 18.0 | $55.00 | $182 |
| 1971 (Nixon Shock) | 40.5 | $24.40 | $409 |
| 1990 (Pre-Internet) | 130.7 | $7.57 | $1,320 |
| 2010 (Post-GFC) | 218.1 | $4.54 | $2,203 |
| 2026 (Current Day) | ~318.0 | $3.11 | $3,215+ |
The Cantillon Effect: Why Asset Owners Win and Cash Loses
When new money is injected into the financial system, it does not distribute evenly across all citizens simultaneously. This dynamic, described by 18th-century economist Richard Cantillon, is known as the Cantillon Effect.
Those closest to the point of money creation — commercial banks, major financial institutions, government contractors, and large asset owners — receive the new capital first, before prices of everyday consumer goods adjust. By the time that capital trickles into consumer wages, prices for essential assets (housing, land, equities, higher education) have already surged higher, creating a persistent divergence between nominal wages and real wealth.
Historical Asset Class Comparison (1971–2026)
While cash held in bank vaults or checking accounts guaranteed a near-total collapse in real purchasing power over the past 50+ years, productive real assets preserved and expanded purchasing power:
- Uninvested Cash: Lost over 87% of its real purchasing power since 1971.
- Gold: Surged from $35/oz in 1971 to over $2,400+/oz in 2026, preserving purchasing power against monetary expansion.
- U.S. Real Estate: Median home prices rose from ~$25,000 in 1971 to over $420,000 in 2026, outpacing headline CPI while generating rental yields.
- S&P 500 Index: Compounded at an annualized nominal return of ~10% (real return ~6.5%–7%), turning $10,000 in 1971 into millions of dollars of real, inflation-adjusted spending power.
Common Mistakes When Analyzing Historical Purchasing Power
- Equating nominal dollar growth with true financial security. If your salary doubles over 20 years from $50k to $100k, but your cost of living triples, your real purchasing power has declined despite having a "six-figure income."
- Treating cash savings accounts as risk-free. While cash in FDIC-insured bank accounts has zero nominal risk of loss, it guarantees 100% certainty of purchasing power decay over multi-decade horizons.
- Ignoring quality adjustments (hedonic adjustments) in CPI. Modern CPI adjustments factor in technological improvements (e.g. today's smartphone does more than a 1990 computer). While technologically true, it often understates the rising cost of raw essentials like shelter, healthcare, and energy.
How to Protect Your Real Purchasing Power Today
- Know Your Exact Numbers: Run your current cash savings and planned retirement withdrawals through our Purchasing Power Calculator to see their projected real value 10, 20, and 30 years out.
- Maintain a Minimum Cash Runway: Keep 3 to 6 months of living expenses in liquid high-yield savings for emergency needs, but invest all surplus capital into productive, inflation-beating assets.
- Diversify into Real Productive Assets: Allocate your wealth across global index equity funds, real estate, and dividend-growing companies modeled on our Dividend Income Calculator.
Before You Rely on This
Historical price indices and monetary trends demonstrate long-term economic tendencies over decades, but short-term market cycles can experience temporary periods of disinflation or deflation. Past performance across asset classes is not a guarantee of future returns.
Disclaimer: The content provided on SmartCalcLabs is for educational and informational purposes only. We are not certified financial planners or investment advisors. Consult a licensed financial advisor before making significant asset allocation or retirement decisions.
Frequently Asked Questions
Did the US Dollar really lose 97% of its purchasing power?
Yes. Based on official Bureau of Labor Statistics (BLS) Consumer Price Index records from 1913 to 2026, an item that cost $1 in 1913 requires approximately $32 to $33 to purchase today, representing an over 97% reduction in purchasing power per dollar unit.
Why don't wages rise at the exact same rate as inflation?
Wage adjustments typically lag behind price inflation ("wage stickiness"). Companies raise consumer prices quickly when input costs surge, but salary increases and wage renegotiations usually happen only annually, causing workers' real purchasing power to compress during high-inflation periods.
What is the difference between disinflation and deflation?
Disinflation means prices are still rising, but at a slower rate (e.g., inflation dropping from 6% to 3.4%). Deflation means prices are actually dropping across the economy (negative inflation rate). In modern fiat systems, prolonged deflation is extremely rare because central banks actively intervene with monetary easing.
Bottom Line
The 100-year history of the US Dollar proves that the real value of paper money is designed to decline over time. By focusing on real purchasing power rather than nominal dollar balances, you can position your wealth to survive inflationary cycles and build genuine multi-generational prosperity.