Inflation is often described by economists as the silent tax. Unlike income tax, which is transparently deducted from your paycheck, inflation silently robs you by shrinking the amount of goods and services each dollar can purchase. Over decades, even modest 3% inflation acts like a financial undertow, cutting the purchasing power of uninvested cash in half every 24 years.
If you are saving for retirement, planning a child's college fund, or holding cash in a traditional bank account, failing to account for compounding inflation can derail your financial security.
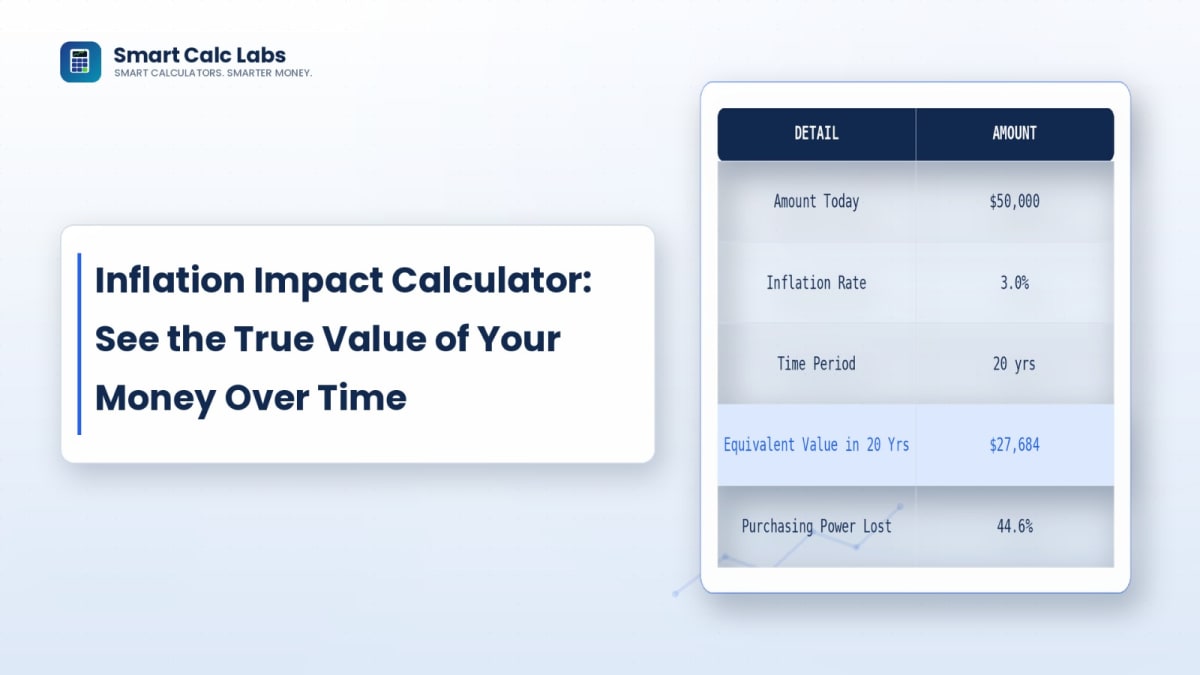
Use our free interactive Inflation Impact Calculator to test your own timeline, or read on to master the math of purchasing power decay, the Rule of 72, and the most resilient asset class inflation hedges.
The Dual Faces of Inflation: Purchasing Power vs. Future Cost
When evaluating inflation, financial analysts evaluate two interconnected mathematical lenses:
1. Purchasing Power Erosion (Cash Perspective)
If you place $100,000 cash in a safe today, how much will that exact $100,000 buy in 20 years? At 3.2% inflation, that $100,000 will only buy $53,190 worth of goods in today's terms—a real wealth loss of over 46%.
2. Future Replacement Cost (Expense Perspective)
If your family spends $70,000 annually to maintain your lifestyle today, how much cash will you need in 20 years to buy the exact same lifestyle? At 3.2% inflation, you will need $131,600 per year—an 88% increase in required cash flow.
The Mathematical Formulas Behind Inflation
Inflation compounds exponentially over time. The two core equations are:
Future Purchasing Power = Present Cash ÷ (1 + r)^n
Future Cost = Present Cost × (1 + r)^n
r is the annual inflation rate (as a decimal, e.g., 0.032) and n is the number of years.
The Rule of 72: The "Half-Life" of Your Money
In physics, radioactive elements have a half-life. In personal finance, cash has a half-life dictated by inflation. You can use the Rule of 72 to instantly determine how many years it will take for your money to lose exactly 50% of its purchasing power:
| Annual Inflation Rate | Years Until Cash Loses 50% Value | Real-World Economic Context |
|---|---|---|
| 2.0% | 36.0 Years | Federal Reserve long-term policy target. |
| 3.2% | 22.5 Years | Historical 100-year US Consumer Price Index average. |
| 4.5% | 16.0 Years | Moderate inflationary cycle / post-crisis expansion. |
| 7.2% | 10.0 Years | High-inflation periods (e.g., 1970s stagflation, 2021–2022 supply shock). |
Multi-Decade Purchasing Power Erosion Matrix
Here is how standard sums of uninvested cash decay over time assuming a baseline 3.2% historical inflation rate:
| Initial Cash Amount | In 5 Years | In 10 Years | In 20 Years | In 30 Years |
|---|---|---|---|---|
| $10,000 | $8,542 (−14.6%) | $7,296 (−27.0%) | $5,324 (−46.8%) | $3,884 (−61.2%) |
| $50,000 | $42,709 (−14.6%) | $36,482 (−27.0%) | $26,619 (−46.8%) | $19,420 (−61.2%) |
| $100,000 | $85,417 (−14.6%) | $72,964 (−27.0%) | $53,238 (−46.8%) | $38,840 (−61.2%) |
| $500,000 | $427,086 (−14.6%) | $364,821 (−27.0%) | $266,189 (−46.8%) | $194,200 (−61.2%) |
Asset Class Comparison: Which Investments Actually Beat Inflation?
Holding cash guarantees a loss in real purchasing power. To build long-term wealth, your capital must earn a positive real return (Nominal Return − Inflation Rate):
| Asset Class | Historical Nominal Return | Real Return (After 3.2% Inflation) | Inflation Protection Mechanism |
|---|---|---|---|
| S&P 500 Index Equities | ~10.0% | +6.8% | Corporations raise prices on consumers to maintain profit margins. |
| Residential Real Estate | ~8.5% (Appreciation + Rent) | +5.3% | Rents and property values adjust upwards with inflation while fixed mortgages stay flat. |
| TIPS & Series I-Bonds | CPI Rate + 1.5%–2.0% | +1.5% to +2.0% | Principal value is directly indexed to the official CPI monthly. |
| Physical Gold / Commodities | ~6.0% | +2.8% | Limited physical supply maintains purchasing parity over century-long horizons. |
| High-Yield Savings (HYSA) | ~4.0% (Current) / ~1.5% (Historical) | +0.8% to −1.7% | Keeps pace during rate hikes, but often lags inflation after taxes. |
| Traditional Checking / Cash | 0.05% | −3.15% | Guaranteed loss of purchasing power every year. |
Use our Investment ROI Calculator and Savings Goal Calculator to model portfolio growth against inflation targets.
Sector Inflation Disparities: Why Headline CPI Is Deceptive
The headline Consumer Price Index is a generalized weighted basket. In reality, the essential expenses that dictate personal financial freedom inflate at vastly different velocities:
- Healthcare & Medical Services: Historically inflates at 4.5% to 6.0% per year—nearly double headline CPI. Long-term retirement planning must account for accelerated medical cost growth.
- Higher Education Tuition: Has averaged 5.0% to 7.0% annual growth over the past three decades. Use our Child Education Cost Planner to project college tuition accurately.
- Shelter & Housing: Rental rates and home replacement costs have consistently outpaced consumer goods inflation in major metropolitan areas.
- Technology & Electronics: Consumer electronics (computers, TVs) actually experience deflation due to technological advancement and manufacturing efficiencies.
5 Critical Mistakes People Make When Ignoring Inflation
- Holding Excess Emergency Cash: While maintaining 3–6 months of living expenses in an emergency fund is crucial, keeping 3–5 years of living expenses in cash guarantees massive purchasing power destruction.
- Confusing Nominal Wage Increases with Real Raises: A 3.5% salary raise during a year when inflation is running at 4.0% is mathematically a 0.5% real pay cut.
- Using Flat Expense Projections in Retirement: Assuming you will spend $60,000/year throughout a 30-year retirement without adjusting for inflation will leave you with a severe budget shortfall by age 75.
- Ignoring Fixed-Rate Mortgage Arbitrage: Inflation is the borrower's best friend. When you hold a 30-year fixed-rate mortgage at 3% or 4%, you are repaying the bank with dollars that become cheaper and cheaper each year.
- Failing to Rebalance Investment Portfolios: Sticking entirely to low-yield cash and short-term CDs out of fear of market volatility exposes you to 100% certainty of purchasing power erosion.
Frequently Asked Questions
How much will $100,000 be worth in 20 years with inflation?
Assuming the historical average US inflation rate of 3.2%, $100,000 in cash will have the purchasing power of approximately $53,238 in today's dollars in 20 years—representing a 46.8% loss in real purchasing capacity.
What is the difference between real and nominal returns?
Nominal return is the raw percentage increase of your money before inflation. Real return is the actual increase in your purchasing power after subtracting inflation. If your stock portfolio earns 8% and inflation is 3%, your real return is 5%.
Does inflation benefit anyone?
Yes. Inflation directly benefits fixed-rate borrowers (such as homeowners with a fixed 30-year mortgage). While their income and asset values typically rise with inflation, their monthly mortgage payment remains permanently locked in nominal dollars.
What is the historical average inflation rate in the US?
Over the past century (1920–2026), the US Consumer Price Index has averaged approximately 3.2% per year. The Federal Reserve maintains an official long-term inflation target of 2.0%.
Calculate Your Future Purchasing Power Today
Take control of your long-term financial trajectory. Enter your current savings or annual expenses into our free Inflation Impact Calculator now to see your numbers projected across 5, 10, 20, and 30 years.