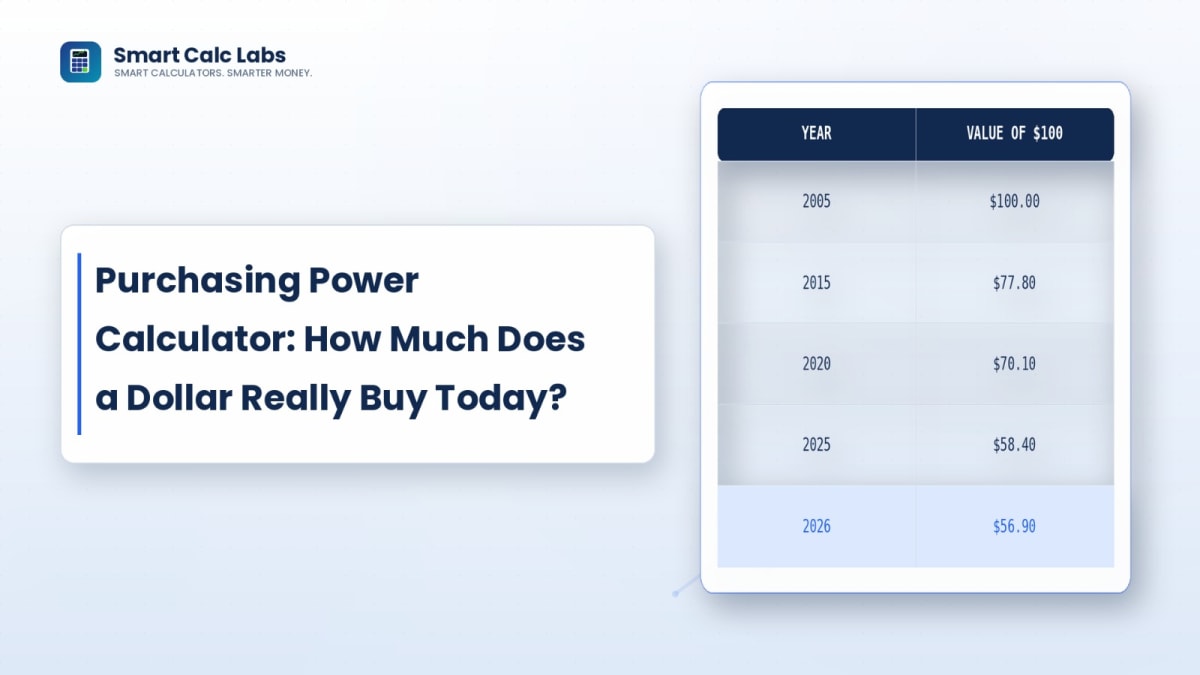
U.S. inflation ran at 3.4% for the 12 months ending July 2026 — still meaningfully above the Fed's 2% target, and elevated further earlier in the year by an energy price shock tied to the Iran conflict. That gap between "official" inflation and "2% target" inflation compounds over time in ways that surprise most people when they actually run the numbers.
Use the Purchasing Power Calculator to see exactly what a specific dollar amount from any past year is worth today, or what today's dollar will be worth in the future — the mechanics behind it are explained below.
Why "Average" Inflation Doesn't Match Your Real Experience
Headline CPI is a national average across a fixed basket of goods — but your personal inflation rate depends heavily on what you actually spend money on. As of July 2026, shelter costs were rising at 3.2% annually and accounted for roughly two-thirds of the monthly CPI increase, while categories like airline fares and used vehicles moved very differently. If you rent in a high-cost city, your real inflation experience is likely running well above the 3.4% headline number; if housing is a small share of your budget, you may be experiencing less.
The Compounding Effect of "Just" 3% Inflation
Inflation compounds the same way investment returns do, just in the opposite direction for your cash. At a steady 3% annual rate, $10,000 sitting in cash today has the purchasing power of only about $7,440 in ten years — a 25% loss in real value without a single dollar being spent. Stretch that to 20 years, and the same $10,000 is worth roughly $5,500 in today's terms. This is why holding large cash reserves for long periods, beyond what you need for near-term goals, is itself a financial decision with a real cost.
Nominal vs. Real Returns
A savings account paying 4% interest during a year of 3.4% inflation is only generating a real return of roughly 0.6% — not the 4% the account statement implies. This distinction matters most when comparing investments: a stock portfolio returning 8% nominally during 3.4% inflation is earning a real return closer to 4.6%. Always think in real (inflation-adjusted) terms when comparing returns across different time periods or asset types, especially since inflation itself has varied significantly over the past few years.
Common Mistakes
- Comparing prices across decades without adjusting for inflation. "A house cost $30,000 in 1980" sounds shocking until you realize that's roughly $115,000-$120,000 in today's dollars — still cheaper than most markets, but not as dramatic as the raw number implies.
- Assuming a single, constant inflation rate applies to everything you buy. Healthcare, education, and housing have historically outpaced headline CPI, while categories like electronics have often gotten cheaper over time even during inflationary periods.
- Using a long-term average inflation rate for short-term planning. The 3.4% annual rate is itself a blend of very different monthly movements — energy prices alone have swung by double digits year-over-year during 2026.
- Ignoring inflation when negotiating a raise or setting savings goals. A 3% annual raise during 3.4% inflation is technically a pay cut in real terms, even though the number on your paycheck went up.
Using This to Plan Ahead
- Enter a historical dollar amount and year to see its equivalent purchasing power today — useful for understanding old prices, past salaries, or inherited savings targets.
- Enter a future time horizon and an assumed inflation rate to see how much today's dollar will realistically be worth — the calculator lets you test both a conservative 2% (the Fed's target) and a more current 3-3.5% assumption.
- Apply the real vs. nominal distinction to any investment return or interest rate you're evaluating elsewhere on the site, particularly our Dividend Income Calculator or Savings Goal Calculator.
Before You Rely on This
Inflation projections are estimates based on historical patterns, not guarantees. The 3.4% figure reflects a specific 12-month period shaped by unusual energy market conditions in 2026 — future inflation could run higher or lower depending on economic and geopolitical developments that are impossible to predict with precision.
Disclaimer: The content provided on SmartCalcLabs is for educational and informational purposes only. We are not certified financial planners or economists. You should always consult with a licensed professional before making significant financial decisions.
The Anatomy of Inflation: BLS Expenditure Weightings and Chained CPI Bias
While headline inflation numbers reported in the financial press provide a macroeconomic snapshot, they rarely reflect the lived financial reality of individual households. The Bureau of Labor Statistics (BLS) constructs the Consumer Price Index for All Urban Consumers (CPI-U) using a fixed basket of goods structured around specific expenditure category weightings:
- Shelter & Housing: Accounts for approximately 36.2% of the headline index (measured primarily through Owners' Equivalent Rent and primary rent contracts).
- Transportation: Represents roughly 15.8% (incorporating new/used vehicle acquisition, motor fuel, airline fares, and vehicle insurance).
- Food & Beverages: Accounts for 13.4% (split between food consumed at home and food away from home).
- Medical Care Commodities & Services: Accounts for 8.1%.
- Energy Commodities & Services: Accounts for approximately 6.9%.
If your personal expenditure profile deviates from these national averages—for instance, if you spend 45% of your net income on urban rent or commute 60 miles daily in an older vehicle—your personalized rate of purchasing power erosion will dramatically outpace the headline 3.0% or 3.5% national metric.
Hedonic Adjustments and Substitution Elasticity
Two methodological mechanisms in the CPI calculation frequently understate visible cash-flow degradation for savers: substitution elasticity and hedonic quality adjustments.
The BLS utilizes the Chained CPI (C-CPI-U), which presumes that when the market price of a specific staple escalates sharply (e.g., choice beef cuts surging 18%), consumers substitute toward cheaper alternatives (such as ground poultry or eggs). Because consumer expenditure shifts downward, the index records a lower rate of price acceleration than an unadjusted fixed basket would report.
Furthermore, hedonic price adjustments statistically remove nominal price increases that technicians attribute to technological improvements. If a computer's retail price rises from $1,200 to $1,350 but features an upgraded processor and doubled memory capacity, hedonic modeling may treat this transaction as a flat price or even a statistical price decline, despite the consumer disbursing $150 more in hard currency. Understanding this gap is why long-term wealth preservation requires exceeding, rather than merely matching, official BLS inflation indices.
The Capital Preservation Hurdle Rate Formula
To prevent purchasing power erosion across taxable accounts, your investment portfolio must achieve a minimum nominal hurdle rate that accounts for both price inflation and federal/state marginal tax drag:
Required Pre-Tax Nominal Return = (Annual Inflation Rate + Target Real Growth) / (1 - Marginal Tax Rate)
For an investor subject to a combined 28% federal and state marginal tax bracket facing 3.5% annual inflation who seeks a modest 2.0% real purchasing power expansion, the calculation reveals:
Nominal Hurdle = (0.035 + 0.020) / (1 - 0.28) = 0.055 / 0.72 = 7.64% pre-tax nominal yield.
Earning 4.5% in a conventional certificate of deposit leaves this investor trailing real purchasing power after taxes, demonstrating that passive cash preservation in an inflationary regime is an active mathematical challenge.
Frequently Asked Questions
Why does the Fed target 2% inflation instead of 0%?
A small, stable amount of inflation gives the Fed room to cut interest rates during downturns without hitting zero, and mild inflation is generally considered less economically disruptive than deflation, which can discourage spending and investment.
Is 3.4% inflation considered high right now?
It's above the Fed's 2% target but well below the 2022-era peaks. As of mid-2026, it reflects a cooling trend from an earlier energy-driven spike, though it remains elevated enough that some Fed officials have discussed the possibility of a rate hike rather than a cut.
Does the calculator account for different inflation rates in different years?
It uses a chosen average annual rate applied consistently across your selected time period. Actual historical inflation has varied significantly year to year, so for precise historical comparisons over long periods, published CPI index data offers more accuracy than a flat average rate.
Bottom Line
Inflation is easy to underestimate because it erodes value quietly rather than all at once. Whether you're comparing an old price to today's dollars or projecting how much your current savings will really be worth in the future, adjusting for inflation — not just nominal dollar amounts — is what makes the comparison meaningful.